
更新时间:2020-01-15 09:59:39
可视化项目:
1、课程目标:
- 实践css布局相关技术
- 实践jquery相关技术
- 掌握echarts的基本使用
2、项目介绍
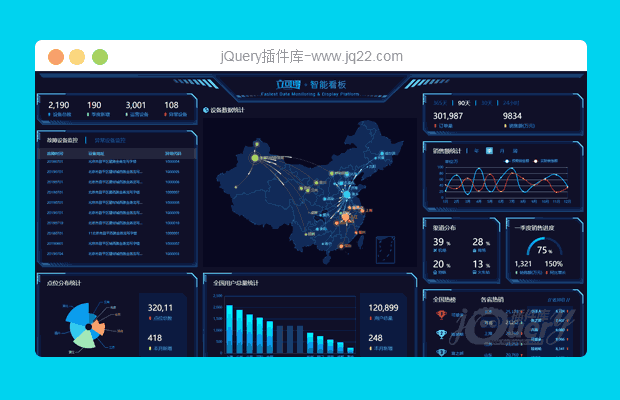
我们要完成这个项目:需要使用一些基础的DIV+CSS布局,还引入了一些C3技术,还引入了各类图表的绘制,以及高级的地图数据可视化案例。主要功能有:饼状图、柱状图、线形图、地图 ...
需要具备知识:
完成该项目需要具备以下知识:
- div + css 布局
- flex 布局
- css3动画
- css3渐变
- css3边框图片
- 原生js + jquery 使用
- rem适配
- echarts基础
3、Echarts-介绍
地址:https://www.echartsjs.com/zh/index.html
ECharts,一个使用 JavaScript 实现的开源可视化库,可以流畅的运行在 PC 和移动设备上,兼容当前绝大部分浏览器(IE8/9/10/11XQ,Chrome,Firefox,Safari等),底层依赖矢量图形库 ZRender,提供直观,交互丰富,可高度个性化定制的数据可视化图表。
理解:实际上就是一个JS插件,可以运行在PC和移动设备,兼容主流浏览器,提供非常多的图表(折线图,柱状图,散点图,饼图,K线图)
4、Echarts-体验
1、下载:下载echarts https://github.com/apache/incubator-echarts/tree/4.5.0
2、进入echarts dist/echarts.min.js【引入】
3、准备一个具备大小(宽高)的 DOM
<div id="main" ></div>
4、初始化echart实例
通过:echarts.init实例化一个容器(内部返回)
var myChart = echarts.init(document.getElementById('main'));5、指定图表的配置项和数据 (根据文档提供示例找到option)
var option = {
    xAxis: {
        type: 'category',
        data: ['Mon', 'Tue', 'Wed', 'Thu', 'Fri', 'Sat', 'Sun']
    },
    yAxis: {
        type: 'value'
    },
    series: [{
        data: [820, 932, 901, 934, 1290, 1330, 1320],
        type: 'line'
    }]
};
6、使用刚指定的配置项和数据显示图表
myChart.setOption(option);
5、Echarts-基础配置
需要了解的主要配置:series xAxis yAxis grid tooltip title legend color
大致划分两大类,有轴的和无轴的
- series
- 系列列表。每个系列通过 type 决定自己的图表类型
- 大白话:图标数据,指定什么类型的图标,可以多个图表重叠。
- xAxis:直角坐标系 grid 中的 x 轴
- yAxis:直角坐标系 grid 中的 y 轴【Y依赖数据显示】
- grid:直角坐标系内绘图网格
- title:标题组件
- tooltip:提示框组件【鼠标放上显示】
- legend:图例组件【需要数据有name属性】
- color:调色盘颜色列表【数组传递】
演示代码:
var option = {
    xAxis: {
        type: 'category',
        data: ['星期一', '星期二', 'Wed', 'Thu', 'Fri', 'Sat', 'Sun']
    },
    yAxis: {
        type: 'value'
    },
    series: [{
        name: '用户注册',
        data: [820, 932, 901, 934, 9222, 1330, 1320],
        type: 'line'
    }, {
        name: '用户数据',
        data: [820, 932, 600, 934, 1290, 1330, 1320],
        type: "bar",
    }],
    grid: {
        show: true,
        // top : 100
    },
    tooltip: {
        trigger: "axis"
    },
    title: {
        text: '年度统计'
    },
    color: ['red', 'yellow'],
    legend: {
        data: ['用户注册', '用户数据']
    }
};
6、REM适配
- 设计稿是1920px ,约定rem基准值为 24px (基准值html的font-size)。【不同设配等比显示,例如320和375等设备】
- [1024-1920]
- 那么:设备宽度与rem基准值比例为 80 。
- 结论:适配设备的时候保持80的比例即可。
- 将来:换算rem单位的时候,使用24px基准值即可。
实现代码,在页面底部加载index.js文件实现动态设置基准值逻辑:
【不用媒体查询,需要查询区间,如果用JS可以实时监控大小】
页面初始化,就需要一个基准值,
(function () {
       // 1、页面一加载就要知道页面宽度计算
      var setFont = function () {
           // 因为要定义变量可能和别的变量相互冲突,污染,所有用自调用函数
           var html = document.documentElement;// 获取html
           // 获取宽度
           var width = html.clientWidth;

           // 判断
           if (width < 1024) width = 1024
           if (width > 1920) width = 1920
           // 设置html的基准值
           var fontSize = width / 80 + 'px';
           // 设置给html
           html.style.fontSize = fontSize;
      }
      setFont();
       // 2、页面改变的时候也需要设置
       // 尺寸改变事件
       window.onresize = function () {
           setFont();
       }
   })();
注意:书写CSS代码,让px转换rem单位,使用一个cscode插件 cssrem
- vscode插件搜索cssrem,进行安装既可
- 需要在设置中cssrem换算的时候使用80的比例
// rem换算
"cssrem.rootFontSize": 24,//【计算时的基准值】
"cssrem.fixedDigits":// 3,【取三位小数】
"cssrem.autoRemovePrefixZero": false,//【是否去除0】
1920设计稿,比例80,基准值24,计算式可能有小数,很多位,保留3为有效小数,不去除0,例如(0.333);
7、基础布局
html结构
<div class="viewport">
    <div class="column">
        <!--概览-->
        <div class="overview panel">

        </div>
        <!--监控-->
        <div class="monitor panel">

        </div>

        <!--点位-->
        <div class="point panel">

        </div>
    </div>
    <div class="column">
        <!-- 地图 -->
        <div class="map">

        </div>
        <!-- 用户 -->
        <div class="users panel">

        </div>
        <div class="column">
            <!-- 订单 -->
            <div class="order panel">
                <div class="inner">
                    <!-- 筛选 -->
                    <div class="filter">

                    </div>
                    <!-- 数据 -->
                    <div class="data">

                    </div>
                </div>
            </div>
            <!-- 销售额 -->
            <div class="sales panel">

            </div>
            <!-- 渠道 季度 -->
            <div class="wrap">

            </div>
            <!-- 排行榜 -->
            <div class="top panel">

            </div>
        </div>
    </div>
- body 设置背景图 ,行高1.15,字体12px,内外边距清除
- viewport 主体容器,限制最小宽度1024px,与最大宽度1920px,最小高度780px。
- 需要居中显示
- 使用logo.png做为背景图,在容器内显示
- 内间距 88px 20px 0
- column 列容器,分三列,占比 3:4:3
- 中间容器外间距 32px 20px 0
css样式:
 /* 基础布局 */
   body{
     font-family: Arial, Helvetica, sans-serif;
     margin: 0;
     padding: 0;
     font-size: 0.5rem;
     line-height: 1.15;
     background: url(../images/bg.jpg) no-repeat 0 0 / cover;
   }
   h4,h3,ul{
     margin: 0;
     padding: 0;
     font-weight: normal;
   }
   ul{
     list-style: none;
   }
   a{
     text-decoration: none;
   }
   .viewport{
     max-width: 1920px;
     min-width: 1024px;
     margin: 0 auto;
     min-height: 780px;
     padding: 3.667rem 0.833rem 0;
     background: url(../images/logo.png) no-repeat 0 0 / contain;
     display: flex;
   }
   .column{
     flex: 3;
     position: relative;
   }
   .column:nth-child(2){
     flex: 4;
     margin: 1.333rem 0.833rem 0;
   }
8、边框图片
css3中自适应边框图片运用:
组合写法:
border-image: url("images/border.jpg") 167/20px round;拆分写法:
border-image-source: url("images/border.jpg");
border-image-slice: 167 167 167 167;
border-image-width: 20px;
border-image-repeat: round;
解释:
- 边框图片资源地址
- 裁剪尺寸(上 右 下 左)单位默认px,可使用百分百。
- 边框图片的宽度,默认边框的宽度。
- 平铺方式:
- stretch 拉伸(默认)
- repeat 平铺,从边框的中心向两侧开始平铺,会出现不完整的图片。
- round 环绕,是完整的使用切割后的图片进行平铺。
DEMO代码:
 <!DOCTYPE html>
   <html>
   <head>
       <meta charset="UTF-8">
       <title>边框图片</title>
       <style>
           ul{
               margin: 0;
               padding: 0;
               list-style: none;
           }
           li{
               width: 350px;
               height: 160px;
               border: 20px solid #ccc;
               margin-top: 20px;
           }
           li:nth-child(1){
               /*border-image: url("images/border.jpg") 167/20px round;*/
               border-image-source: url("images/border.jpg");
               border-image-slice: 167 167 167 167;
               border-image-width: 20px;
               /*环绕  是完整的使用切割后的图片进行平铺*/
               border-image-repeat: round;
           }
           li:nth-child(2){
               /*平铺 从边框的中心向两侧开始平铺 会出现不完整的图片*/                                         border-image: url("images/border.jpg") 167/20px repeat;
           }
           li:nth-child(3){
               /*默认的平铺方式*/
               border-image: url("images/border.jpg") 167/20px stretch;
           }
       </style>
   </head>
   <body>
   <ul>
       <li></li>
       <li></li>
       <li></li>
   </ul>
   </body>
   </html>
9、公用面板样式
所有的面板的基础样式是一致的,提前布局好。
- 面板 .panel :box-sizing,边框图,大小,定位【51 38 21 132】
- 容器 .inner:padding:24,36,定位外部拉宽
- 标题 h3:20px,颜色
 /* 面板样式 */
   .panel{
     box-sizing: border-box;
     border: 2rem solid transparent;
     border-width: 2.125rem 1.583rem 0.833rem 5.5rem;
     border-image: url(../images/border.png) 51 38 21 132;
     margin-bottom: 0.833rem;
     position: relative;
   }
   .panel .inner{
     padding: 1rem 1.5rem;
     position: absolute;
     top: -2.125rem;
     right: -1.583rem;
     bottom: -0.833rem;
     left: -5.5rem;
   }
   .panel h3{
     font-size: 0.833rem;
     color: #fff;
   }
10、概览区域-布局
html结构:
<div>
    <div>
        <div>
            <h4>2,190</h4>
            <span>
                 <i  ></i>
                 设备总数
               </span>
        </div>
        <div>
            <h4>190</h4>
            <span>
                 <i  ></i>
                 季度新增
               </span>
        </div>
        <div>
            <h4>3,001</h4>
            <span>
                 <i  ></i>
                 运营设备
               </span>
        </div>
        <div>
            <h4>108</h4>
            <span>
                 <i  ></i>
                 异常设备
               </span>
        </div>
    </div>
</div>
样式描述:
- 容器高度 110px
- h4字体 28px #fff 左边距 4.8px 下间隙 8px
- span字体 16px #4c9bfd
- 注意:引入图标地址(fonts文件夹里面的css)
   /* 概览区域 */
   .overview{
     height: 4.583rem;
   }
   .overview .inner{
     display: flex;
     justify-content: space-between;
   }
   .overview h4{
     font-size: 1.167rem;
     padding-left: 0.2rem;
     color: #fff;
     margin-bottom: 0.333rem
   }
   .overview span{
     font-size: 0.667rem;
     color: #4c9bfd;
   }
11、监控区域-布局
html结构:
<!--监控-->
<div class="monitor panel">
    <div class="inner">
        <div class="tabs">
            <a href="javascript:;" data-index="0" class="active">故障设备监控</a>
            <a href="javascript:;" data-index="1">异常设备监控</a>
        </div>
        <div class="content" style="display: block;">
            <div class="head">
                <span class="col">故障时间</span>
                <span class="col">设备地址</span>
                <span class="col">异常代码</span>
            </div>
            <div class="marquee-view">
                <div class="marquee">
                    <div class="row">
                        <span class="col">20180701</span>
                        <span class="col">11北京市昌平西路金燕龙写字楼</span>
                        <span class="col">1000001</span>
                        <span class="icon-dot"></span>
                    </div>

                </div>
            </div>
结构解释:
- .tabs 标签选项 加上active激活选项 默认激活第一个选项
- .content 切换内容 加上显示内容 默认激活第一个内容
样式描述:
- .inner 容器内间距 24px 0
- .tabs 容器内间距 0 36px
- a 容器 颜色: #1950c4 内间距:0 27px 字体:18px
- 第一个a容器 去除左侧内间距 加上右侧2px宽度边框#00f2f1
- 激活的时候 颜色白色
- .content容器
- 占满剩余高度 flex:1
- 默认隐藏
- .head 容器
- 行高 1.05 背景 rgba(255, 255, 255, 0.1) 内间距 12px 36px 颜色 #68d8fe 字体大小 14px
- row 容器
- 行高 1.05 内间距 12px 36px 颜色 #68d8ff 字体大小 12px
- .icon-dot 字体图标 绝对定位 左边0.64rem 透明度0
- 鼠标经过后:背景 rgba(255, 255, 255, 0.1) 透明度1
- col容器
- 宽度:3.2rem 8.4rem 3.2rem
- 第二个col 一行不换行 溢出 省略
/* 监控 */
.monitor {
	height:20 rem;
}
.monitor.inner {
	padding:1 rem 0;
	display:flex;
	flex - direction:column;
}
.monitor.tabs {
	padding:0 1.5 rem;
	margin - bottom:0.75 rem;
}
.monitor.tabs a {
	color:#1950c4;
	font-size:0.75rem;
	padding:0 1.125rem;
}
.monitor .tabs a:first-child {
	border-right:0.083rem solid # 00 f2f1;
	padding - left:0;
}
.monitor.tabs a.active {
	color:#fff;
}
.monitor.content {
	flex:1;
	display:none;
	position:relative;
}
.monitor.head {
	background:rgba(255,255,255,0.1);
	font - size:0.583 rem;
	padding:0.5 rem 1.5 rem;
	color:#68d8fe;
	display:flex;
	justify-content:space-between;
	line-height:1.05;
}
.monitor .col:nth-child(1) {
	width:3.2rem;
}
.monitor .col:nth-child(2) {
	width:8.4rem;
	/* 不换行  一行省略*/
    white-space:nowrap;
	overflow:hidden;
	text-overflow:ellipsis;
}
.monitor .col:nth-child(3) {
	width:3.2rem;
}
.monitor .marquee-view {
	position:absolute;
	top:1.6rem;
	bottom:0;
	width:100%;
	overflow:hidden;
}
.monitor .row {
	line-height:1.05;
	padding:0.5rem 1.5rem;
	color:# 61 a8ff;
	font - size:0.5 rem;
	position:relative;
	display:flex;
	justify - content:space - between;
}
.monitor.row:hover {
	color:#68d8ff;
	background:rgba(255,255,255,0.1);
}
.monitor .row:hover .icon-dot {
	opacity:1;
}
.monitor .icon-dot {
	position:absolute;
	left:0.64rem;
	opacity:0;
}
.monitor .marquee-view {
	position:absolute;
	top:1.6rem;
	bottom:0;
	width:100%;
	overflow:hidden;
}
.monitor .row {
	line-height:1.05;
	padding:0.5rem 1.5rem;
	color:# 61 a8ff;
	font - size:0.5 rem;
	position:relative;
	display:flex;
	justify - content:space - between;
}
.monitor.row:hover {
	color:#68d8ff;
	background:rgba(255,255,255,0.1);
}
.monitor .row:hover .icon-dot {
	opacity:1;
}
.monitor .icon-dot {
	position:absolute;
	left:0.64rem;
	opacity:0;
}
上午回顾:
echarts:是一个JavaScript插件库,图标插件
应用:下载==>引入(dist/echarts.min.js),传入对象,设置,设置配置
rem:1024-1920:获取大小,设置比例,设置字体
边框:border-images:url(地址) 分割大小/宽度 拉伸;
边框,结构
点击切换
12、监控区域-效果
切换功能:
- 绑定 标签页点击 事件
- 点击的时候获取data-index的值
- 当前容器加active其他容器移除active
- index对应的内容容器显示其他容器隐藏
// 切换
$('.monitor').on('click','.tabs a', function(){
   $(this).addClass('active').siblings().removeClass('active')
   $('.monitor .content').eq(this.dataset.index).show().siblings('.content').hide()
})
动画功能:
- 实现思路:
- 先克隆列表,追加在后面
- marquee-view 占满剩余高度,溢出隐藏
- 绝对定位,top 1.6rem bottom 0
- 宽度100%,溢出隐藏
- 使用animation实现动画
- 使用 translateY 向上位移 50%
- 动画时间15s,匀速播放,循环执行。
js代码:
// 动画
$('.marquee').each(function() {
    var $cloneList = $(this).children().clone()
    $(this).append($cloneList)
})
css代码:
/* 动画 */
.monitor.marquee - view {
        position: absolute;
        width: 100 % ;
        top: 1.6 rem;
        bottom: 0;
        overflow: hidden;
    }
    .monitor.marquee {
        animation: scroll - top 15 s linear infinite;
    }
    .monitor.marquee: hover {
        animation - play - state: paused;
    }
@keyframes scroll - top {
    0 % {}
    100 % {
        transform: translateY(-50 % );
    }
 }
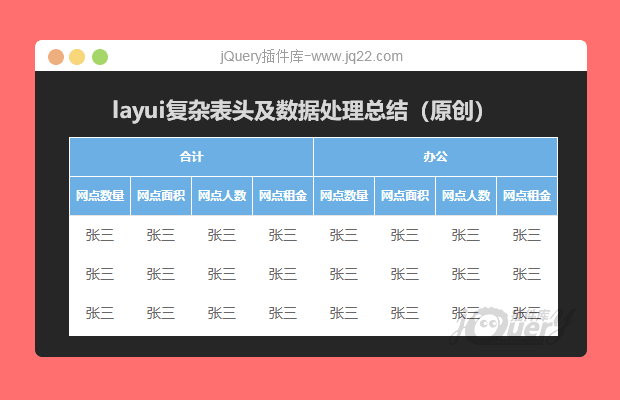
layui的复杂表头及数据处理总结(原创)
在layui的官网有些东西是查不到的,这给我 们造成很多的误解,在网上也找不到成套的实例用法。在这里总结了layui框架的复杂表头的拼接及数据的展示,希望给大家的开发,带来些实用的方便。讨论这个项目(15)回答他人问题或分享插件使用方法奖励jQ币 评论用户自律公约
-
怎么把地图换成省啊
-
页面加载后,底下的部分没有显示完全,请问有没有办法自适应页面(我用的火狐浏览器)。感谢。
-
我想问一下,中间的那个地图是如何实现呢?可以改地图中的样式吗
- 😀
- 😉
- 😥
- 😵
- 😫
- 😘
- 😡
- 👍
- 🌹
- 👏
- 🍺
- 🍉
- 🌙
- ⭐
- 💖
- 💔
- 😀
- 😉
- 😥
- 😵
- 😫
- 😘
- 😡
- 👍
- 🌹
- 👏
- 🍺
- 🍉
- 🌙
- ⭐
- 💖
- 💔

