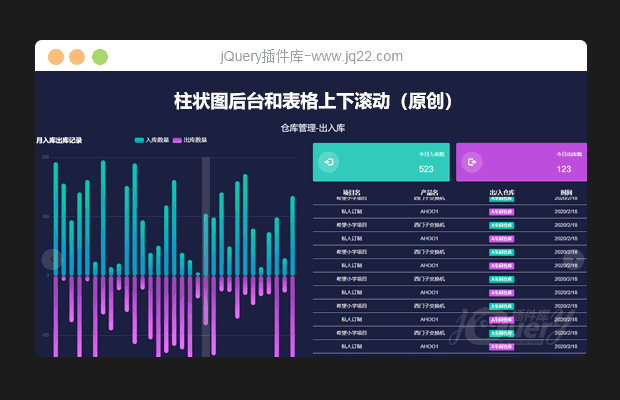

插件描述:柱状图基于ets,table表格自动滚动的方法已经注解 可以修改速度 从多少条开始滚动
更新时间:2020-02-29 23:31:48
使用方法
这个的ak是我自己的 你们可以换成你们的
<script type="text/javascript" src="https://api.map.baidu.com/api?v=2.0&ak=0xdI6Lq0agqBHUtthykRldY7gMTM378p"></script>
这两个echarts主题可用可不用
<!-- 引入主题 -->
<script src="js/chalk.js"></script>
<script src="js/purple-passion.js"></script>
这里是柱状图自动显示tooltip的 我设置的3秒
var app = {
    currentIndex: -1,
};
setInterval(function() {
    var dataLen = option.series[0].data.length;
    // 取消之前高亮的图形
    myChart.dispatchAction({
        type: 'downplay',
        seriesIndex: 0,
        dataIndex: app.currentIndex
    });
    app.currentIndex = (app.currentIndex + 1) % dataLen;
    //console.log(app.currentIndex);
    // 高亮当前图形
    myChart.dispatchAction({
        type: 'highlight',
        seriesIndex: 0,
        dataIndex: app.currentIndex,
    });
    // 显示 tooltip
    myChart.dispatchAction({
        type: 'showTip',
        seriesIndex: 0,
        dataIndex: app.currentIndex
    });
}, 3000);
//table滚动方法
// 参数1 tableID,参数2 div高度,参数3 速度,参数4 tbody中tr几条以上滚动
tableScroll('tableId', 200, 60, 5)
PREVIOUS:
NEXT:
相关插件-图表,滚动
讨论这个项目(4)回答他人问题或分享插件使用方法奖励jQ币 评论用户自律公约
Empty 0
2020/4/27 15:21:57
-
因为只想要滚动的功能,所以另外的代码有点多了,看着就很乱,如果该功能 能够单独拿一个例子出来就更好了
😃
- 😀
- 😉
- 😥
- 😵
- 😫
- 😘
- 😡
- 👍
- 🌹
- 👏
- 🍺
- 🍉
- 🌙
- ⭐
- 💖
- 💔
😃
取消回复
- 😀
- 😉
- 😥
- 😵
- 😫
- 😘
- 😡
- 👍
- 🌹
- 👏
- 🍺
- 🍉
- 🌙
- ⭐
- 💖
- 💔

