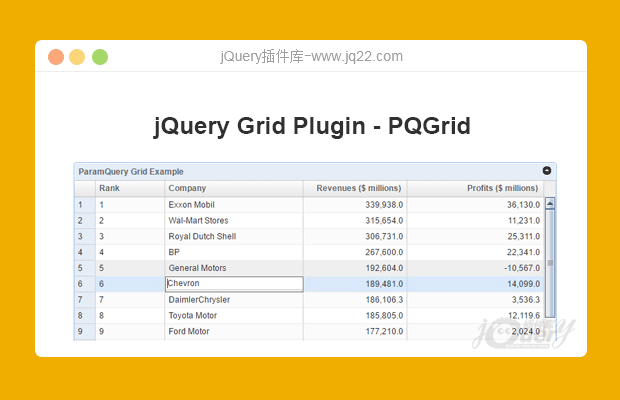

插件描述:jQuery多功能表格插件Param Query Grid开源,能自己修改代码,皮肤也能自己定制,能够单独引入项目(不需要复制进一堆无关的东西),对于简单的后台项目比较适用
ParamQuery插件特点:
排序
分页浏览
可以调整数据栏的大小
可以调整表格的高度和宽度
自定义主题
隐藏或显示列
像Excel那样冻结任意多列
显示任意数据源格式,像HTML、数组、XML、JSON等
可以用于任意服务端框架,像ASP.NET、MVC3、JSP、JSF、PHP等等
虚拟滚动和渲染
直接编辑单元格
在所有主流浏览器(IE 6+、Firefox、Chrome、Opera等等)上拥有一致的外观和功能
实用方法:
先在html的head中加入对jQuery和jQuery UI的引用:
<link rel="stylesheet" href="http://libs.useso.com/js/jqueryui/1.10.0/css/smoothness/jquery-ui-1.10.0.custom.min.css" />
<script src="http://libs.baidu.com/jquery/1.8.3/jquery.min.js"></script>
<script src="http://libs.useso.com/js/jqueryui/1.9.1/jquery-ui.min.js"></script>
再加入对Param Query Grid的引用:
//这个css文件必须引用,无论你是用了皮肤,还是没有用到皮肤,都要引用
<link rel="stylesheet" href="/Content/pqgrid/pqgrid.min.css" />
//这个js文件必须引用
<script type="text/javascript" src="/Scripts/pqgrid.min.js" ></script>
增加脚本代码:
$(function() {
    var data = [[1, 'Exxon Mobil', '339,938.0', '36,130.0'], [2, 'Wal-Mart Stores', '315,654.0', '11,231.0'], [3, 'Royal Dutch Shell', '306,731.0', '25,311.0'], [4, 'BP', '267,600.0', '22,341.0'], [5, 'General Motors', '192,604.0', '-10,567.0'], [6, 'Chevron', '189,481.0', '14,099.0'], [7, 'DaimlerChrysler', '186,106.3', '3,536.3'], [8, 'Toyota Motor', '185,805.0', '12,119.6'], [9, 'Ford Motor', '177,210.0', '2,024.0'], [10, 'ConocoPhillips', '166,683.0', '13,529.0'], [11, 'General Electric', '157,153.0', '16,353.0'], [12, 'Total', '152,360.7', '15,250.0'], [13, 'ING Group', '138,235.3', '8,958.9'], [14, 'Citigroup', '131,045.0', '24,589.0'], [15, 'AXA', '129,839.2', '5,186.5'], [16, 'Allianz', '121,406.0', '5,442.4'], [17, 'Volkswagen', '118,376.6', '1,391.7'], [18, 'Fortis', '112,351.4', '4,896.3'], [19, 'Crédit Agricole', '110,764.6', '7,434.3'], [20, 'American Intl. Group', '108,905.0', '10,477.0']];
    var obj = {
        width: 700,
        height: 400,
        title: "ParamQuery Grid Example",
        resizable: true,
        draggable: true
    };
    obj.colModel = [{
        title: "Rank",
        width: 100,
        dataType: "integer"
    },
    {
        title: "Company",
        width: 200,
        dataType: "string"
    },
    {
        title: "Revenues ($ millions)",
        width: 150,
        dataType: "float",
        align: "right"
    },
    {
        title: "Profits ($ millions)",
        width: 150,
        dataType: "float",
        align: "right"
    }];
    obj.dataModel = {
        data: data
    };
    $("#grid_array").pqGrid(obj);
});
最后,在要显示的地方加入div元素,用来显示表格:
<div id="grid_array"></div>
搞定,运行就能看到效果。
PREVIOUS:
NEXT:
相关插件-图表
讨论这个项目(6)回答他人问题或分享插件使用方法奖励jQ币 评论用户自律公约
😃
- 😀
- 😉
- 😥
- 😵
- 😫
- 😘
- 😡
- 👍
- 🌹
- 👏
- 🍺
- 🍉
- 🌙
- ⭐
- 💖
- 💔
😃
取消回复
- 😀
- 😉
- 😥
- 😵
- 😫
- 😘
- 😡
- 👍
- 🌹
- 👏
- 🍺
- 🍉
- 🌙
- ⭐
- 💖
- 💔

